A comparison of UK sectors based on web presence and official statistics

Company websites have become an essential marketing tool to promote brands, products and services, to attract future employees, collaborate with partners, and to interact with current and potential customers. At Glass we believe that any organisation that “matters” in the economy is likely to have a website. Furthermore, we believe that company websites can provide useful clues around the sizes, the strategies, the networks, the sectors and the growth rates of companies, as this recent Office for National Statistics (ONS) post suggests.
In this blog post, we analyse the web presence of the different sectors in the UK economy and compare the results with the breakdown of sectors presented by official statistics.
The web is a digital copy of a large part of the economy but there are differences in the web representation of sectors when compared to official data.
Some sectors that have a large volume of companies in the official statistics seem to have a smaller presence on the web. This post aims to uncover some of the differences and suggest potential explanations.
UK businesses with a website
According to the UK Office for National Statistics, 45% of all the UK’s businesses have a website. This percentage seems quite low so we decided to investigate further. Our data scientists carried out some tests using Companies House data and the results showed that approximately 30% of all UK registered companies have a website. Surprisingly, the percentages were even lower than the numbers provided by the ONS. This means that out of 4 million companies registered in Companies House, approximately 1.2M companies (30% of the total) have a website. It is worth noting that not all UK “businesses” are listed in Companies House. The ONS Business Population Estimates (BPE) has a total of 5.7 million businesses, including the 4 million companies from Companies House and also sole traders, partnerships, and government organisations.
Based on these numbers, we have estimated there are approximately 1.7 million organisations in the UK with a website, 1.2 million of which are companies. The Glass AI engine currently reads and interprets the websites of 1.5 million UK businesses.
The relationship between sector and web presence
Using the UK web data and the official data from Companies House, we followed several steps to understand the presence of different sectors online versus their share in official statistics:
First, we mapped the official SIC codes to the Glass sector taxonomy of 108 sectors. The SIC classification contains 732 codes which are part of broader industry sections. In our experiment, we managed to assign Glass sectors to most SIC codes. For each SIC, the most representative Glass sector was the one with the maximum number of matches.
In a second step, we decided to exclude from the Glass and Companies House datasets those organisations that are outside the private sector. Also, we excluded sectors that were poorly represented, including:
Governmental organisations;
Charities and Foundations;
Schools and Universities;
Sectors with insufficient information.
Third, after filtering and assigning the different sectors, the Glass to SIC mapping covered 85 Glass sectors (out of 108). Depending on the activity, each sector had a different number of corresponding SIC codes (see examples in Table 1). Food and Beverages had the highest number of mapped SIC codes and covered activities related to production, distribution and services in food and beverages. On the other side, the sector Libraries had only one SIC code assigned as it references a very specific activity.

Table 1. Example of Glass sectors mapped to SIC codes
As mentioned earlier, the Companies House dataset does not cover the entire UK economy: it contains information on about 4m UK businesses, of which a sizeable proportion are dormant. At this point for each group of SIC codes, we determined the number of active and non-dormant registered businesses and calculated the relative proportion of each group in Companies House. A similar approach was used to determine the share of sectors based on the UK web data.
The final step was to compare the UK web with the Companies House sector breakdown. We aimed to quantify the differences and identify which sectors seem to be overrepresented or underrepresented on the web. We also performed a geographical comparison for the UK. As seen in Figure 1, each UK region has a slightly different representation on the web by volume (compared to official statistics).
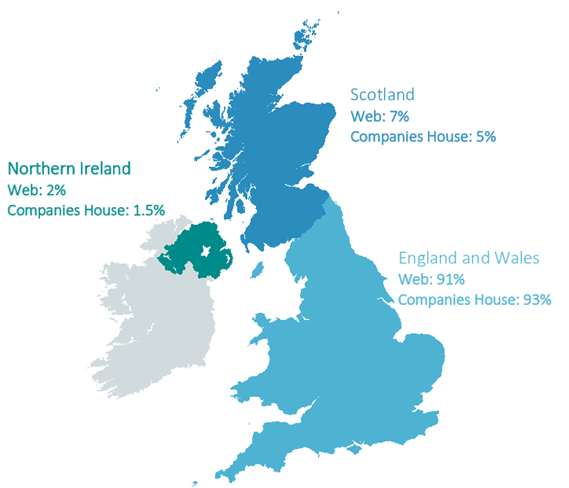
Figure 1. Web versus Companies House
Results of the sectors analysis
Several factors can influence the representation of companies and sectors on the web and official statistics:
As we know, not all officially registered companies have a website;
Companies from specific sectors are more likely to have a website;
Some UK regions and counties may have a different business presence on the web. This can be influenced by the regional industry composition or policies of regional and local governments. Geographical (Regional) comparison is a very interesting research topic which we aim to address in a future analysis.
Sectors with the highest share
The Glass sectors Real Estate & Property Management and Construction were the top sectors by volume in the official statistics. This is not surprising as the 2017 BPE figures showed Construction as the top industry by the number of UK private businesses. We noticed that the proportions for these two sectors were quite high (> 8.5%) given that the overall Companies House sector distribution is highly varied.
The analysis of the web data, however, showed a different behaviour: we saw lower proportions for the dominant sectors and less extreme values. Hospitality and Restaurants (4.3%) was the top sector, closely followed by Construction with 4.2% of the total number of businesses.

Table 2. Sectors with the highest share by volume (representation)
Initial conclusion was that the web and official data seemed to show different sector breakdowns. One potential reason for the difference is that not all registered businesses have a website, and this is particularly common in some specific sectors. The next part of our analysis tried to identify the reasons for such differences by looking at differences between sector shares.
Sectors representation on the web
More than two-thirds of the Glass sectors (78%) had a higher web presence than expected based on the official statistics and 19% of the sectors had a lower web presence. Those sectors with higher than expected web presence were, on average, 0.5% more present online than in the official data, while for those sectors with a bigger Companies House share, the average was 1.4%.
Health, Wellness and Fitness businesses were 2.47% more represented on the web than in Companies House, while Real Estate and Property Management had a 6.62% share bigger in Official Statistics.
Could it be that many Construction, Real Estate and Consulting businesses choose not to have a website? It may be that most companies in these sectors are too small to have a website or that the nature of the sector means that businesses do not necessarily need a website. Another hypothesis is that many individuals in these sectors may choose to set up limited companies to offer their services in a more tax-efficient way compared to self-employment.
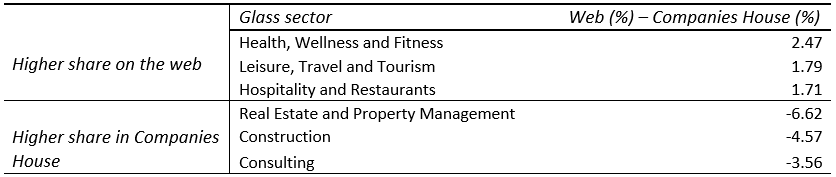
Table 3. Differences between sector shares
In addition, we saw some interesting patterns when we further inspected which sectors are overrepresented in Companies House and on the web. These sectors could be clustered around two types of activities:
1. Sectors under-represented on the web that can have lots of micro-businesses (e.g. Consulting, Construction) or focused on professional services activities (where people are the “product/service”). According to the BPE (2017), 83% of Construction businesses are “sole proprietorships and partnerships with only a self-employed owner-manager and companies with one employee, assumed to be an employee director”. We could argue that for small and micro businesses in the construction sector, having a website may not add that much value. We also noticed that the Retail and Food and Beverages sectors had a higher share in Companies House compared to their share of the UK web. This could be related to Companies House including many local businesses and corner shops registered as companies, which again, might not necessarily need a website.
2. Sectors over-represented on the web, for example, sectors in Leisure-related activities (e.g. Wellness & Fitness, Travel, Photography). These sectors are more outwardly facing, possibly aiming for broader audiences. We suspect these sectors may have many sole traders that are not necessarily registered as a business in Companies House. For this types of businesses, having an online presence brings a significant advantage.
Conclusion
This sector comparison of official data with web data was another attempt to understand and gain insights into the UK economy with web data. We discovered that some sectors with a large share in the official statistics had a smaller presence on the web. At the same time, other sectors seemed to be overrepresented on the web, probably due to the importance of having a website for their economic activity. This was our first attempt to look into this area.
Our next blog post will try to identify the top companies in the UK based on their web presence, in other words, we will use the open web data as a proxy for estimating the size and importance of UK companies.